Some Helpful Tools
Lesson (A)
Use the information below to answer questions 1 - 5. Type your answers in the spaces provided.
Lesson (B)
Use the information below to answer questions 1 - 5. Type your answers in the spaces provided.
Lesson (C)
Use the information below to answer questions 1 - 7. Type your answers in the spaces provided.
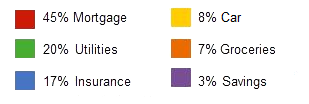
How much is spent on utilities in a year?
How much is spent on groceries during the year?
How much is spent on car expense during the year?
What amount is put towards savings?
How much more is spent on utilities expense than car expense during the year?
Hint: Set up a proportion to solve these problems. Remember to cross multiply.
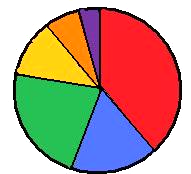
Cars Manufactured
Cars Sold
What was the number of cars manufactured in the month of February?
Use the hint if necessary to answer this question.
What was the least number of cars sold?
Which month showed the greatest increase of cars sold?
What is the ratio of cars sold to cars manufactured for the month of March?
What is the difference between the number of cars manufactured and the cars
sold in the month of April?
Based on Annual Income of $179,000
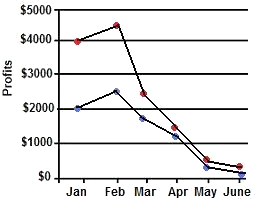
Comparison of Profit Made During
January Through June of 2007 and 2008
Truffles Comforters & Quilts
year 2008
year 2007
Hint: If a bar is shown between the
numbers, say that is the middle point.
For example: The middle point
between 1000 and 2000 is 1500.
The Answer Key is found in the Some Helpful Tools section at the bottom of this page.
1.
2.
3.
4.
5.
1.
2.
3.
4.
5.
1. The above graph shows a comparison of ______ .
2. Which months does the graph cover? ______ .
4.
5.
6.
During the months shown, what is the greatest amount of profit made? ______
What is the least amount of profit made?
Hint: The middle point between the numbers is approximately $500. Show
your answer half of $500.
What is the ratio of the least amount of profit to the greatest amount of profit?
Why do you think there was a decrease in profit during the months of May
and June for both years?
3. What period of time does the graph cover? ______ .
7.
Math: Graphs - Lessons